Personal Pro Dashboard

Deeper analysis to better reach your goals

Capture and aggregate meaningful data

Readings securely sync in virtual real-time from the mobile app to the dashboard.

Accurate & Convenient Data Capture

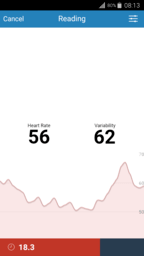
Conveniently capture HRV directly from the FREE mobile app – anytime, anywhere. Get the app >

Deeper Analysis

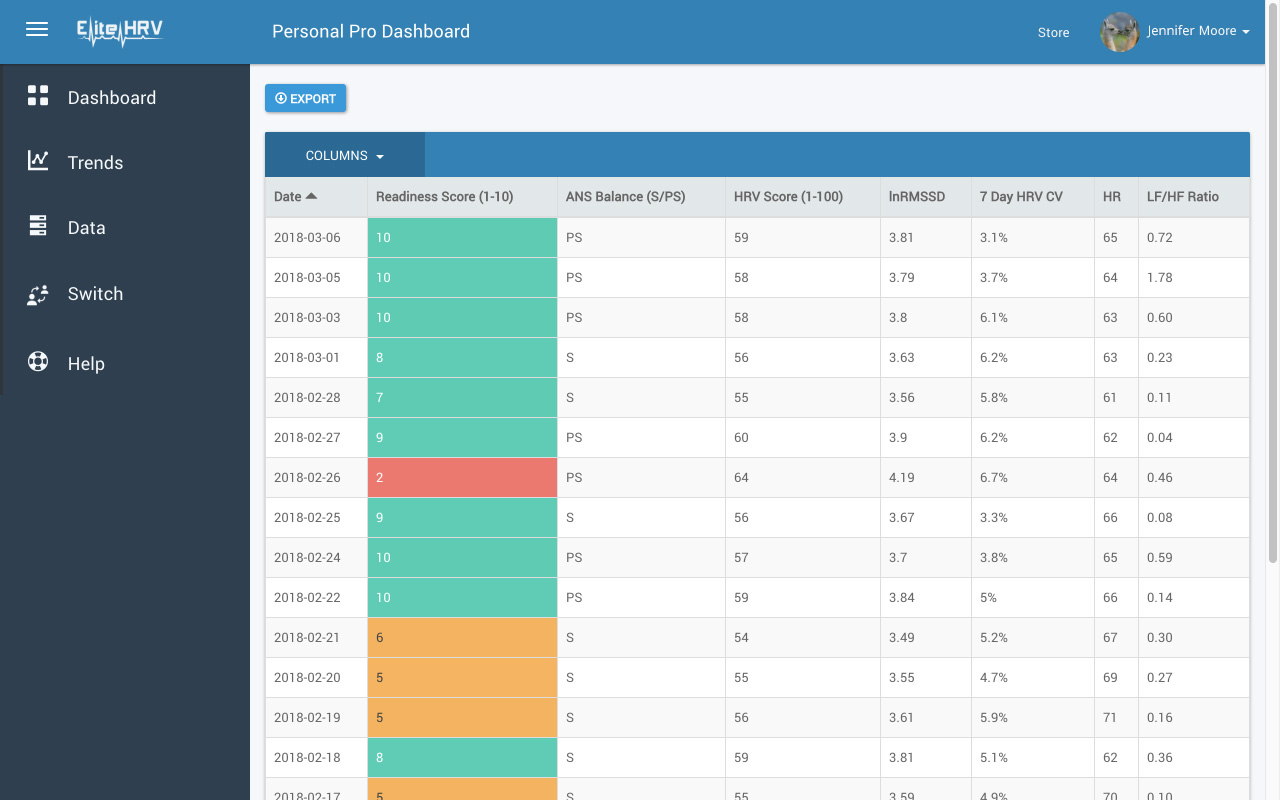
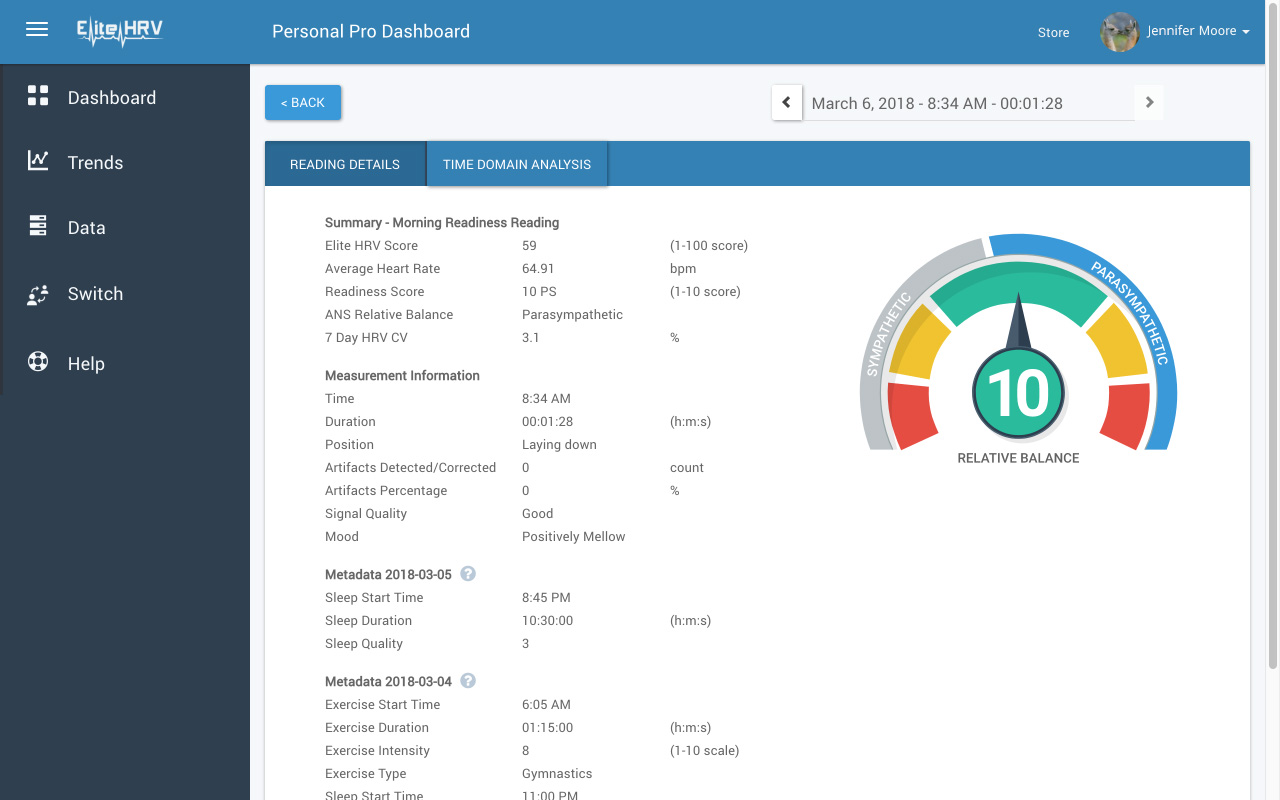
Dig deeper into individual measurements and more easily analyze your historical data.

Trend Progress

Trend your data with custom charting and smart filters.

More Than Just HRV

Analyze important contextual data such as sleep, exercise, mood, and lifestyle data alongside HRV. Seamlessly captured in the app.

Data Quality Alerts

The signal quality gauge alerts you of measurement artifacts and rates your measurement quality to ensure you are analyzing valid data.

Data Export

Easily export your raw RR data, calculated HRV values and metadata.

Real-time Data Syncing

Automatically sync data world-wide for analysis in the dashboard with secure SSL encryption, automatic cloud backups and unlimited data storage.
dashboard quality alert icon

Optimal Reading Length

Due to heavy server demand, we cannot currently process readings longer than 1 hour. Readings longer than 30 minutes may take several hours to process.

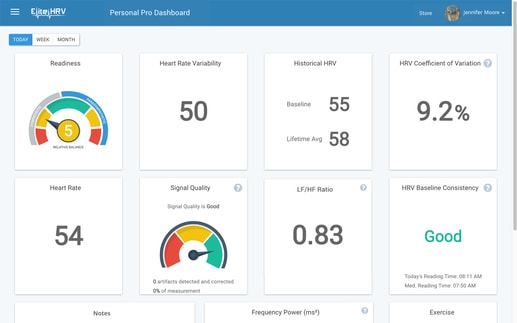
Quickly see your progress


  • Today, Week, Month summaries
  • Readiness gauge and indicator
  • HRV Score
  • Coefficient of Variation of HRV
  • Heart Rate
  • Signal Quality Rating
  • Total Power, Low Frequency, High Frequency
  • LF/HF Ratio
  • Consistence/confidence Rating
  • Exercise
  • Sleep

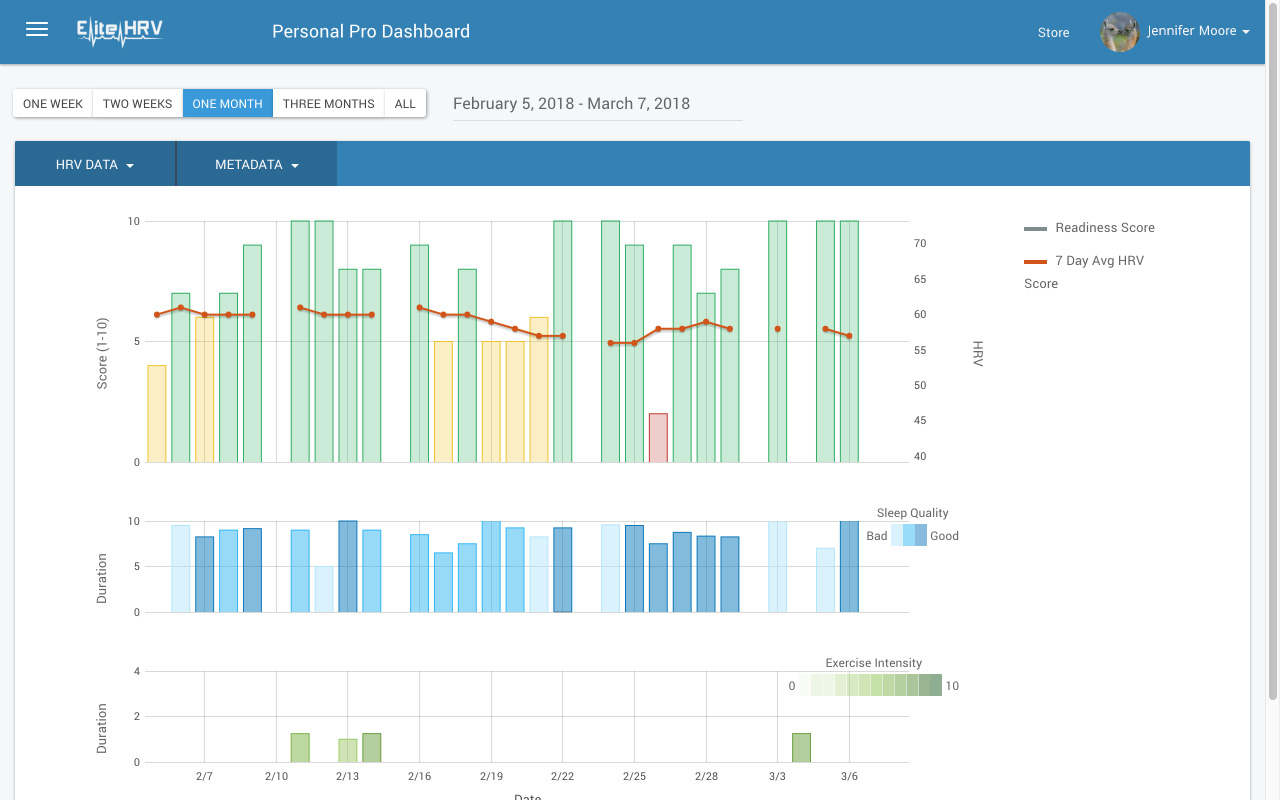
Trend progress and correlate physiology to behavior patterns


  • Trend HRV metrics
    • HRV score
    • Readiness score
    • Time Domain indices
    • Frequency Domain indices
  • Trend sleep and exercise lifestyle data against HRV values contextualize progress
  • Analyze custom date ranges
  • Hover and select an measurement to dig deeper into

Access detailed history


  • View all historical measurements and filter and sort data
  • HRV time domain and frequency domain values and tags
  • View all types of measurements in the Data table view – Morning Readiness, Guided Breathing, Open Readings, etc.
  • Export raw and calculated HRV values select individuals

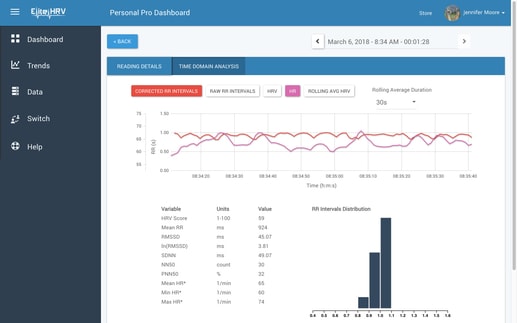
Analyze individual measurements


  • Easily scroll between measurements
  • Measurement information: date/time, duration, position, mood
  • Signal quality information: artifacts detected and corrected, signal quality indicator
  • Elite HRV’s HRV score, Morning Readiness score and indicator, ANS balance gauge, coefficient of variation
  • Heart Rate data
  • Time Domain HRV values
  • RR time series chart with corrected and raw RRs
  • Measurement HR and rolling average HRV
  • RR intervals Distribution chart
  • Frequency Domain HRV values
  • Power Spectral Density chart
  • Measurement tags and metadata displayed for previous 3 days

Your Data

Quality checks and alerts. Artifact detection and correction. Secure back-ups.

Elite HRV Values

HRV Score, Readiness Score, Green/Yellow/Red Readiness Indicator, Autonomic Nervous System balance gauge

Time Domain Values

Mean RR, rMSSD, ln(rMSSD), SDNN, NN50, PNN50, Coefficient of Variation.

Frequency Domain Values

Total Frequency Power, Low Frequency Power, High Frequency Power, LF/HF ratio, Power Spectral Density using FFT Welch’s Periodogram and Autoregressive Models

Raw Data

Want the raw data so you can do your own analysis? Easily export your raw RR data and calculated HRV values.

Simple Pricing. $8 per month

No contracts. Cancel at anytime.