Improving HRV Data Interpretation with the Coefficient of Variation

Apr 12, 2017 | Android, Blog, iOS, News, Research, Training

This is a guest post written by Andrew Flatt, Exercise Physiology PhD, Researcher, and Professor at the University of Alabama, HRVtraining.com, @andrew_flatt
Interpreting smartphone-derived HRV data (specifically, lnRMSSD) for the purposes of monitoring training responses has predominantly focused on where your number falls on a scale. Is your score high or low relative to your baseline? Here, emphasis is placed on the acute (i.e., daily) change in HRV. This method of analysis was popularized by the landmark study of Kiviniemi et al.1 in 2007 where HRV-guided training based on daily, waking HRV in the standing position resulted in superior endurance performance improvements than pre-planned training. This approach to HRV-guided training is quite reactive, requiring the user to make daily training modifications. This may or may not be practical for individuals and is certainly highly impractical for use among sports teams.

A different approach to HRV-guided training, based on weekly averages, immerged based on (e.g.,) research by Buchheit et al.2 in 2010. This observational study found that subjects who improved endurance performance following an 8-week training period also showed progressive improvements in their weekly-averaged HRV. This contrasted with subjects who showed no endurance improvements and consequently unchanged or even reduced weekly-averaged HRV.

Averaging HRV data across the week accounts for daily fluctuation in your scores (i.e., acute changes) that can be misleading when interpreted in isolation. For example, two recent investigations by Plews et al.3 and Le Meur et al.4 found that an acute HRV score was unable to detect training responses in endurance athletes throughout training but when the data was averaged weekly, associations with the training response were observed. This encouraged the adoption of the rolling average in practice (for example 5-7) as it provides a more accurate reflection of overall training adaptation. Additionally, it enables training to be less hyper-reactive to acute changes that may or may not have relevance (i.e., noise) as it would require a trend of low or high scores to impact the direction of the rolling average.

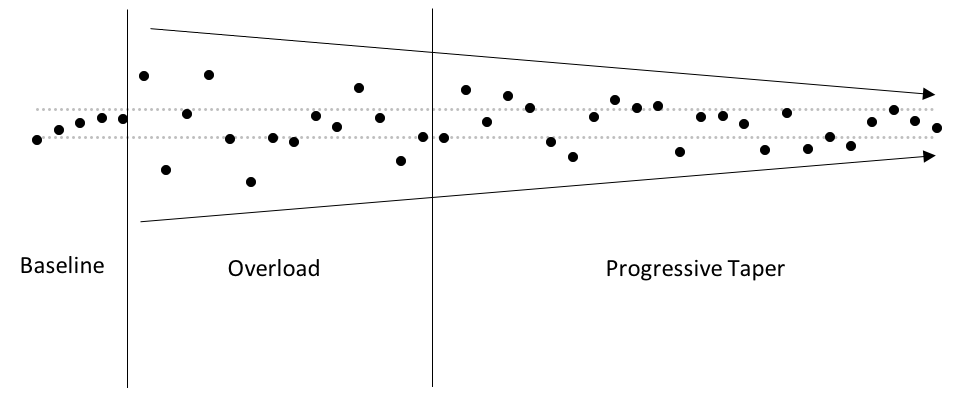
A limitation of averaged HRV data is that it does not reflect the magnitude of fluctuation in HRV that occurs throughout the week. Figure 1. shows that despite no meaningful change in the HRV average throughout training, there is a noticeable progressive reduction in daily fluctuation. This adaptive response would be overlooked if one only considered mean HRV changes to be meaningful.


Figure 1. HRV data from an Olympic level short-distance swimmer preparing for successful competition. The black dots represent daily HRV scores and the dashed gray line represents the smallest worthwhile change.


Fluctuation is quantified using the coefficient of variation (CV) which is simply calculated as the standard deviation (of the HRV data) divided by the mean HRV value and expressed as a percentage. While the mean HRV reflects average vagal or parasympathetic activity, the CV represents perturbations occurring therein, such as the stress (decreases in HRV) and recovery (return to at or above baseline) response to training and lifestyle events.

As it turns out, the amount of daily fluctuation is quite meaningful. The CV inversely relates to fitness parameters such as maximum aerobic speed, intermittent running performance and VO2max in team-sport athletes8-10 Athletes who are more fit tend to show less fluctuation in their daily HRV scores (i.e., a smaller CV value). This may be explained in part by the fact that fit individuals demonstrate accelerated parasympathetic reactivation following intense exercise compared with less-fit individuals.11-13

A nice real-world example of this can be found in a recent study that evaluated relationships between training intensity and HRV among elite rowers.14 It was found that training at an intensity <lactate threshold tended to increase HRV while training at an intensity >lactate threshold tended to cause decreased HRV. However, the magnitude of the correlation between high intensity training and HRV was lower than the relationships with low intensity training because 2 subjects didn’t show much decrease in their HRV the morning following high intensity sessions. These 2 subjects also happened to be the only Olympic Gold medalists of the group. In general, athletes that are more fit and of higher training status show less day to day fluctuation in HRV and consequently a smaller CV.

The CV of HRV relates to fitness in cross-sectional analyses as described above, but how do changes in the CV relate to changes in fitness? In one of our recent studies, we evaluated the relationship between changes in HRV CV from week 1 to week 3 of a 5-week training program with changes in intermittent running performance (YoYo Test) from pre- to post training in soccer players. We found that individuals who saw a decrease in their CV tended to experience greater improvements in fitness while those who saw an increase in their CV tended to experience smaller improvements, or in some cases no change or reduced fitness. As training progressed, individuals who were adapting best to training were showing less fluctuation in their HRV scores. An example of this can be observed below in Figure 2.


Figure 2. Week 1 and Week 3 HRV trends depicting a favorable versus less favorable response to training based on eventual changes in intermittent running performance.


Given that high intensity exercise tends to reduce HRV for a day or two after training,13 it would be reasonable to assume that periods of heavier training load would increase the CV (due to greater HRV fluctuations in response to training) compared with periods of lighter training load. This was demonstrated in a study be Schmitt et al.15 who found that when fatigued, elite endurance athletes showed “scattered” HRV numbers compared with when they reported less fatigue. We observed a similar response previously in collegiate soccer players where during a high load training week, the athletes demonstrated high fluctuation in HRV along with decrements in perceived wellness markers. This was compared with a subsequent low load week where HRV became more stable and wellness ratings improved.10,16

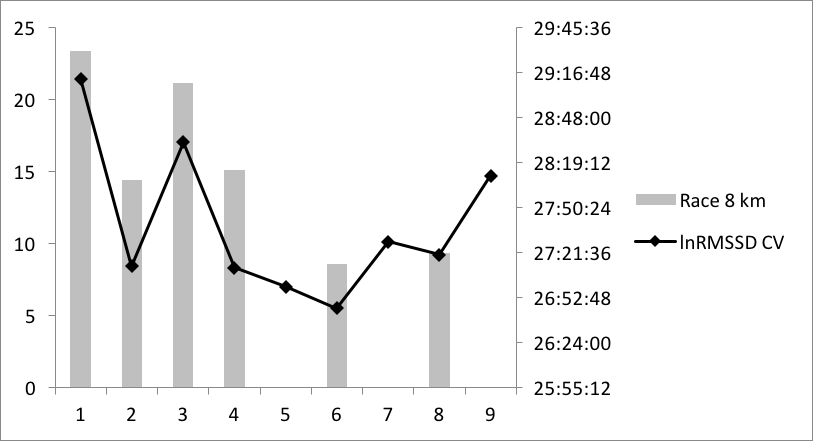
Research evaluating the relationship between the CV and performance is limited. However, after retrospectively analyzing a season’s worth of HRV and performance data in a collegiate cross-country athlete, we observed a near perfect relationship between the weekly CV and weekly 8 km race times.17 The athlete performed faster race times during weeks with a smaller CV and slower race times during weeks with a higher CV (Figure 3.). Even when running the same course under similar conditions (weather, time of day) weeks apart, the athlete ran 1:49 (min:sec) faster when his CV was roughly 50% lower than when he competed at this course previously. This was despite no meaningful difference in his HRV weekly mean value. As this was only a single subject case study, more research is certainly needed to investigate the relationship between the CV and performance.


Figure 3. Weekly 8 km race times and HRV CV throughout a cross country season.


One must also consider the effect that non-training factors have on HRV when interpreting the data. Events that are highly stressful to an individual as well as factors such as poor sleep quality, excess alcohol consumption, travel and so forth can all contribute to substantial reductions in HRV and thus impact the CV. In this regard, an increase in the CV when training is otherwise non-excessive may be a result of non-training factors that should be investigated. We observed this in a highly fit and veteran soccer player whose CV nearly doubled from one week to the next despite only a small change in weekly training load.18 However, this athlete reported a substantial increase in perceived stress (largest change in any wellness parameter among all subjects) based on wellness questionnaire data which very likely may have contributed to the increased CV.

This example highlights the importance of monitoring not just training load and performance indicators for meaningful interpretation, but also non-training factors (e.g., wellness questionnaires) to add appropriate context for course of action. Even trends that would appear to indicate a positive coping response (i.e. progressive increase in HRV) can actually be reflecting parasympathetic hyperactivity as a result of excess endurance training volumes (less likely to occur in team-sport and anaerobic athletes).4,19 Both parasympathetic and sympathetic forms of overreaching have been well documented20 and therefore users must take a holistic approach to training monitoring by factoring in multiple makers of training status to correctly identify positive or negative responses.

So, what are some typical CV values among various populations? First, understand that the position HRV is measured in will impact the CV. Supine CV values will be lower than standing CV values.16 Secondly, appreciate that the CV changes in response to training and lifestyle factors, so this must be taken into context when making comparisons. Few studies have reported HRV CV values (regarding lnRMSSSD) but the following will summarize most of what’s available. Elite male triathletes during baseline training have been reported to have a supine CV of 6.7 ± 2.9% while recreational endurance athletes had CV values of 10.1 ± 3.4%21 and 12.7%.22 Collegiate women’s soccer (NAIA) players have demonstrated average CV values of 6.7 ± 3.5%.10 from supine measures during the offseason while NCAA D-1 players have shown CV values of 7.7 ± 3.3% from seated measures during preseason. The CV from seated HRV measures for elite male rugby players during a short training camp was 7.65%.23 Professional indoor male soccer players had seated CV values of around 10% during the early preseason which improved to an average of about 7% in the late preseason.24

Excluding the recreational athletes, it appears that between 6-8% is a pretty common average for CV values among a variety of athletes. However, understand that individual values range from as low as 1% to >20%. In my experience working primarily with collegiate athletes (soccer, swimming and American Football), the higher level and more fit athletes often have a CV ranging between 2-6%. The athletes that are less fit or of lower training status typically have CV values in the 7-12% range. Keep in mind these are general ranges and there are always exceptions.

While this article has focused primarily on the CV, HRV mean and CV should be evaluated together to determine 1) The direction of the trend (i.e., increasing or decreasing) and 2) the amount of fluctuation occurring within. Focusing on one alone can be misleading or simply fail to capture important information. For example, in a case study of an elite triathlete who experienced non-functional overreaching, the CV went from being quite large (scattered HRV numbers) to progressively decreased when the athlete finally experiences serious illness.5 On its own, a reduction in the CV would appear to be a positive coping response based on previous findings. However, this reduction in the CV occurred with a concomitant reduction in the HRV mean. In other words, HRV decreased and remained chronically suppressed (reduced CV), a highly unfavorable response. Thus, the mean and CV should be assessed together to avoid misinterpretations of the training response.

“Good” versus “Bad” trends differ tremendously based on athlete, training phase, fitness level, sport and so on. Knowledge of physiology, training principles, context of the current phase and end-goal enable critical evaluation of the situation and therefore appropriate action to take regarding training and recovery interventions. The user or coach should determine the potential cause of the trend changes via referencing training load, performance and wellness data to implement an appropriate intervention in effort to facilitate a more desirable training response. HRV provides unique physiological insight regarding how the individual is responding to training that is not reflected in subjective measures. It is up to the user or coach to interpret this information correctly and match programming accordingly.

Look beyond the HRV scale, beyond the color coding and beyond the “readiness” algorithms that are popular among HRV software. Though these can certainly be useful and are no doubt well intentioned, they cannot think critically or apply context to a situation that an informed coach can via tracking numerous markers of training status and by applying experience-based intuition supported by established relationships with the athletes.

Though I’m always reluctant to provide general interpretation guidelines given that each situation and athlete is unique (and I’ve undoubtedly yet to experience them all), below are some basic guidelines that may be useful to users. Remember that interpreting the data is only half the battle. Taking action with appropriate interventions is where everything pays off and is the reason why you’re monitoring this stuff in the first place.

Trend: Increased CV, no change or small decrease in HRV mean

  • Indicates an increase in physiological stress. Typical during new training phases (novel training stimuli) or increases in training load. A possible early indication of fatigue. This also tends to occur in situations of detraining.

Trend: Decreased CV, moderate to large decrease in HRV mean

  • Indicates a more severe level of physiological stress and generally the least favorable response in athletes when purposeful overreaching is not desired. Best not to let persist for >1 week.

Trend: Decreased CV, increase in HRV mean

  • Indicative of positive adaptation and possible increase in fitness. Would suggest that the athlete is handling training very well. Typical with reduced training load or tapering. However, under situations of very high volumes of endurance training, this trend is likely indicative of parasympathetic hyperactivity and fatigue.

References

1. Kiviniemi AM, Hautala AJ, Kinnunen H, Tulppo MP. Endurance training guided individually by daily heart rate variability measurements. European journal of applied physiology. 2007;101(6):743-751.

2. Buchheit M, Chivot A, Parouty J, et al. Monitoring endurance running performance using cardiac parasympathetic function. European journal of applied physiology. 2010;108(6):1153-1167.

3. Plews DJ, Laursen PB, Kilding AE, Buchheit M. Evaluating training adaptation with heart-rate measures: a methodological comparison. International journal of sports physiology and performance. 2013;8(6):688-691.

4. Le Meur Y, Pichon A, Schaal K, et al. Evidence of parasympathetic hyperactivity in functionally overreached athletes. Med Sci Sports Exerc. 2013;45(11):2061-2071.

5. Plews DJ, Laursen PB, Kilding AE, Buchheit M. Heart rate variability in elite triathletes, is variation in variability the key to effective training? A case comparison. European journal of applied physiology. 2012;112(11):3729-3741.

6. Stanley J, D’Auria S, Buchheit M. Cardiac parasympathetic activity and race performance: an elite triathlete case study. International journal of sports physiology and performance. 2015;10(4):528-534.

7. Vesterinen V, Nummela A, Heikura I, et al. Individual Endurance Training Prescription with Heart Rate Variability. Medicine and science in sports and exercise. 2016.

8. Buchheit M, Mendez-Villanueva A, Quod MJ, Poulos N, Bourdon P. Determinants of the variability of heart rate measures during a competitive period in young soccer players. European journal of applied physiology. 2010;109(5):869-878.

9. Boullosa DA, Abreu L, Nakamura FY, Muñoz VE, Domínguez E, Leicht AS. Cardiac autonomic adaptations in elite Spanish soccer players during preseason. International journal of sports physiology and performance. 2013;8(4):400-409.

10. Flatt AA, Esco M, Nakamura FY, Plews DJ. Interpreting daily heart rate variability changes in collegiate female soccer players. The Journal of sports medicine and physical fitness. 2016.

11. Hautala A, Tulppo MP, Mäkikallio TH, Laukkanen R, Nissilä S, Huikuri HV. Changes in cardiac autonomic regulation after prolonged maximal exercise. Clinical Physiology. 2001;21(2):238-245.

12. Seiler S, Haugen O, Kuffel E. Autonomic recovery after exercise in trained athletes: intensity and duration effects. Medicine and science in sports and exercise. 2007;39(8):1366.

13. Stanley J, Peake JM, Buchheit M. Cardiac parasympathetic reactivation following exercise: implications for training prescription. Sports medicine (Auckland, NZ). 2013;43(12):1259-1277.

14. Plews DJ, Laursen PB, Kilding AE, Buchheit M. Heart-rate variability and training-intensity distribution in elite rowers. International journal of sports physiology and performance. 2014;9(6):1026-1032.

15. Schmitt L, Regnard J, Desmarets M, et al. Fatigue shifts and scatters heart rate variability in elite endurance athletes. PloS one. 2013;8(8):e71588.

16. Flatt AA, Esco MR. Smartphone-Derived Heart-Rate Variability and Training Load in a Women’s Soccer Team. International journal of sports physiology and performance. 2015;10(8):994-1000.

17. Flatt AA, Esco MR. Endurance performance relates to resting heart rate and its variability: A case study of a collegiate male cross-country athlete. J Aus Strength Cond. 2014;22:39-45.

18. Flatt AA, Esco MR, Nakamura FY. Individual heart rate variability responses to preseason training in high level female soccer players. Journal of strength and conditioning research/National Strength & Conditioning Association. 2016.

19. Bellenger C, Karavirta L, Thomson R, Robertson E, Davison K, Buckley J. Contextualising Parasympathetic Hyperactivity in Functionally Overreached Athletes With Perceptions of Training Tolerance. International journal of sports physiology and performance. 2015.

20. Lehmann M, Foster C, Dickhuth H-H, Gastmann U. Autonomic imbalance hypothesis and overtraining syndrome. Medicine and science in sports and exercise. 1998;30(7):1140-1145.

21. Plews DJ, Laursen PB, Le Meur Y, Hausswirth C, Kilding AE, Buchheit M. Monitoring training with heart rate-variability: how much compliance is needed for valid assessment? International journal of sports physiology and performance. 2014;9(5):783-790.

22. Al Haddad H, Laursen P, Chollet D, Ahmaidi S, Buchheit M. Reliability of resting and postexercise heart rate measures. International journal of sports medicine. 2011;32(08):598-605.

23. Nakamura FY, Pereira LA, Esco MR, et al. Intra-and inter-day reliability of ultra-short-term heart rate variability in rugby union players. Journal of strength and conditioning research/National Strength & Conditioning Association. 2016.

24. Nakamura FY, Pereira LA, Rabelo FN, et al. Monitoring weekly heart rate variability in futsal players during the preseason: the importance of maintaining high vagal activity. Journal of sports sciences. 2016:1-7.